Analytics: decoyrail stats
decoyrail status answers one question: what has this month cost so far.
decoyrail stats answers the rest: what did my agents spend and do, over
which window, broken down by session, model, host, or day, with the security
events (denies, tripwires, DLP alerts) given the same prominence as the
dollars. It reads only the local audit log. Nothing leaves your machine, and
no network access is needed.
decoyrail stats                        # today, broken down by model
decoyrail stats --window week          # this week (Monday start, local time)
decoyrail stats --window month --by session
decoyrail stats --since 2026-06-01 --until 2026-06-30 --by day
decoyrail stats --json                 # machine-readable, schema v1
decoyrail stats --line                 # one line, built for embedding
A typical report:
Window: today (2026-07-10T04 to 2026-07-11T04 UTC)
Requests: 41 (39 allowed, 0 warned, 2 denied: 1 policy, 1 tripwire, 0 dlp, 0 budget)
Security: 1 tripwire hits, 0 DLP alerts, 0 policy tampers
Tokens: in 48.2k  out 12.9k  cache read 1.1M  cache write 22.0k  cached 96%
Spend: $1.8420
Plan-absorbed: ~$3.1080 API-equivalent (subscription traffic, not billed)
Bytes: up 1.2 MB  down 6.4 MB
Latency: avg 830ms  p95 ~2.0s  max 9.4s  (39 measured)

By model:
  claude-sonnet-5                    21 req  in   612.4k  out     7.1k  $1.8420  cached 96%
  claude-sonnet-5 [subscription]     16 req  in   501.2k  out     5.8k  $0.0000  plan-absorbed ~$3.1080  cached 95%
  (no usage data)                     4 req  in        0  out        0  $0.0000  [2 alerts]
Zeros are printed on purpose. A window with no tripwires saying "0 tripwire hits" is itself a report; silence would be ambiguous. The plan-absorbed line appears only when subscription traffic exists in the window: it is the API-equivalent reference cost of plan-covered requests (see metering), reported next to spend and never summed into it.
Windows and breakdowns
--window today | week | month | all. Days start at local midnight; the week starts Monday; the month on the 1st.--since YYYY-MM-DD [--until YYYY-MM-DD]for a custom range, local dates, both inclusive. Overrides--window.--by session | model | host | daypicks the breakdown table in the human view. The JSON output always contains all four.
Sessions are decoyrail run invocations. Each one writes a session event
labeling itself with the command it launched, so --by session shows
claude -p "fix the tests" rather than a bare pid. A long-running
decoyrail proxy appears as one session labeled proxy.
Where the numbers come from
Every number derives from the audit log, never from meter.json. The meter
zeroes itself at month rollover; the audit log does not, which is what makes
"compare this month to last" possible. Spend is the sum of provider-reported
token usage priced per model, exactly what metering recorded per request.
Requests whose response carried no usage are counted in a visible
no_usage_requests bucket and cost $0.00 here; they are never priced by
guesswork (the byte-derived estimate exists only in decoyrail status,
labeled as an estimate).
Streamed responses report usage after the response finishes, as a companion
usage event referencing the original request. Stats correlates the two, so
a streamed request counts exactly once in every breakdown.
Latency comes from per-request durations the proxy records. Events written
by older Decoyrail versions have no duration; they are shown in the request
counts but excluded from the latency figures (the measured count says how
many requests the figures cover). The p95 is approximate, computed from a
log-scale histogram, and marked with ~.
Repeat queries are fast
The first query after new traffic parses only the audit lines added since
the previous query and folds them into ~/.decoyrail/stats-cache.json, an
hour-granular aggregate. Repeat queries answer from that cache, so months of
history come back in well under a second. The cache is disposable: delete it
and the next query rebuilds it from the log.
Integrity
Every ingested line is verified against the hash chain, and the last event
is checked against the head anchor. If the chain is broken or the log was
truncated, the report still shows what could be read, with the failure
flagged at the top of every output mode (the human view, the JSON
integrity object, and a prefix on the one-liner). A mid-file edit made
after a line was already ingested is caught by the full pass of
decoyrail log --verify, which re-derives the chain from the beginning.
Stats output contains only metadata that is already safe in the audit log: hosts, rule names, counts, token totals, fingerprints. Never secret values, prompts, or payloads. One caveat worth knowing: session labels are the command lines you ran, so if you pass a secret as a CLI argument it will show there, exactly as it already would in your shell history.
The one-line mode
decoyrail stats --line emits exactly one line with three fields: today's
total tokens, dollars, and alert count, in that order.
1.2M tok $4.31 3 alertsThe alert count is denies plus tripwire hits plus DLP alerts plus warn
events plus policy tampers, each counted once. If the audit chain fails verification the line is prefixed
with [audit integrity FAILED] . This format is a compatibility promise:
poll it from a menu bar app or a statusline every few seconds and nothing
about it will change shape within a major version. For anything richer, use
--json.
The JSON contract (schema v1)
decoyrail stats --json emits a versioned report. schema increments only
on breaking changes. Running the same query twice with no new traffic
returns byte-identical output, and the numbers are always identical to the
human view of the same window.
{
  "schema": 1,
  "window": {"kind": "today", "from": "2026-07-10T04", "to": "2026-07-11T04"},
  "integrity": {"ok": true, "detail": null},
  "totals": { ... bucket ... },
  "by_session": [{"sid": "…", "label": "claude -p hello", "started": "…", "pid": 812, ... bucket ...}],
  "by_model":  [{"name": "claude-sonnet-5", ... bucket ...}],
  "by_host":   [{"name": "api.anthropic.com", ... bucket ...}],
  "by_day":    [{"name": "2026-07-10", ... bucket ...}]
}window.from/window.to are half-open UTC hour bounds (YYYY-MM-DDTHH);
null means unbounded (--window all). Every bucket, totals and breakdown
rows alike, has the same shape:
| Field | Meaning |
|---|---|
requests, allows |
requests seen, requests forwarded |
warns |
requests forwarded under the warn action: the per-host rows answer "what would break under default deny" (added in a v1-compatible way; absent means an older binary) |
denies |
{total, policy, tripwire, dlp, budget}, denies by reason |
tripwires |
tripwire hits: request-side denies plus response echoes |
dlp_alerts |
DLP warn or mask hits (blocking hits are in denies.dlp) |
policy_tamper |
policy loads rejected as tampered (out-of-band edit, missing record) |
policy_changes |
policy writes and blessings made through Decoyrail surfaces |
tokens |
{input, output, cache_read, cache_write, total} |
cache_hit_ratio |
cache_read / (input + cache_read), null with no context tokens |
cost_usd |
sum of per-request metered cost (subscription traffic is $0) |
plan_absorbed_usd |
API-equivalent reference cost of subscription traffic: what the plan absorbed at API rates, cache multipliers included. Never part of cost_usd (added in a v1-compatible way; absent means an older binary) |
no_usage_requests |
allowed requests whose response carried no usage |
bytes |
{up, down} as seen at the proxy |
duration_ms |
{avg, p95, max, measured}, null when nothing was measured |
Breakdown rows are sorted by cost (then requests, then name), except
by_day, which is chronological. Model rows use the meter's model key, so
plan-covered traffic shows as <model> [subscription] and never blends into
a pay-per-token row; requests without usage data group under
(no usage data).
The waste report: decoyrail stats --waste
Where stats says what was spent, --waste says what was spent for nothing, broken down by cause and priced in dollars:
- Retried identical requests: the same request (same destination, method, and body, matched by the spend tripwire's salted fingerprint) re-sent within the tripwire's window. Every re-send after the first is waste, priced at what its response actually metered.
- Runaway loops: the same, past the tripwire's repeat threshold. Repeats the tripwire blocked are counted alongside (they cost nothing; the report shows the loop's true length).
- Prompt-cache waste: repeating context that re-billed at the full input rate for want of a cache marker, priced by the cache doctor for the current billing period;
decoyrail cachehas the per-model breakdown.
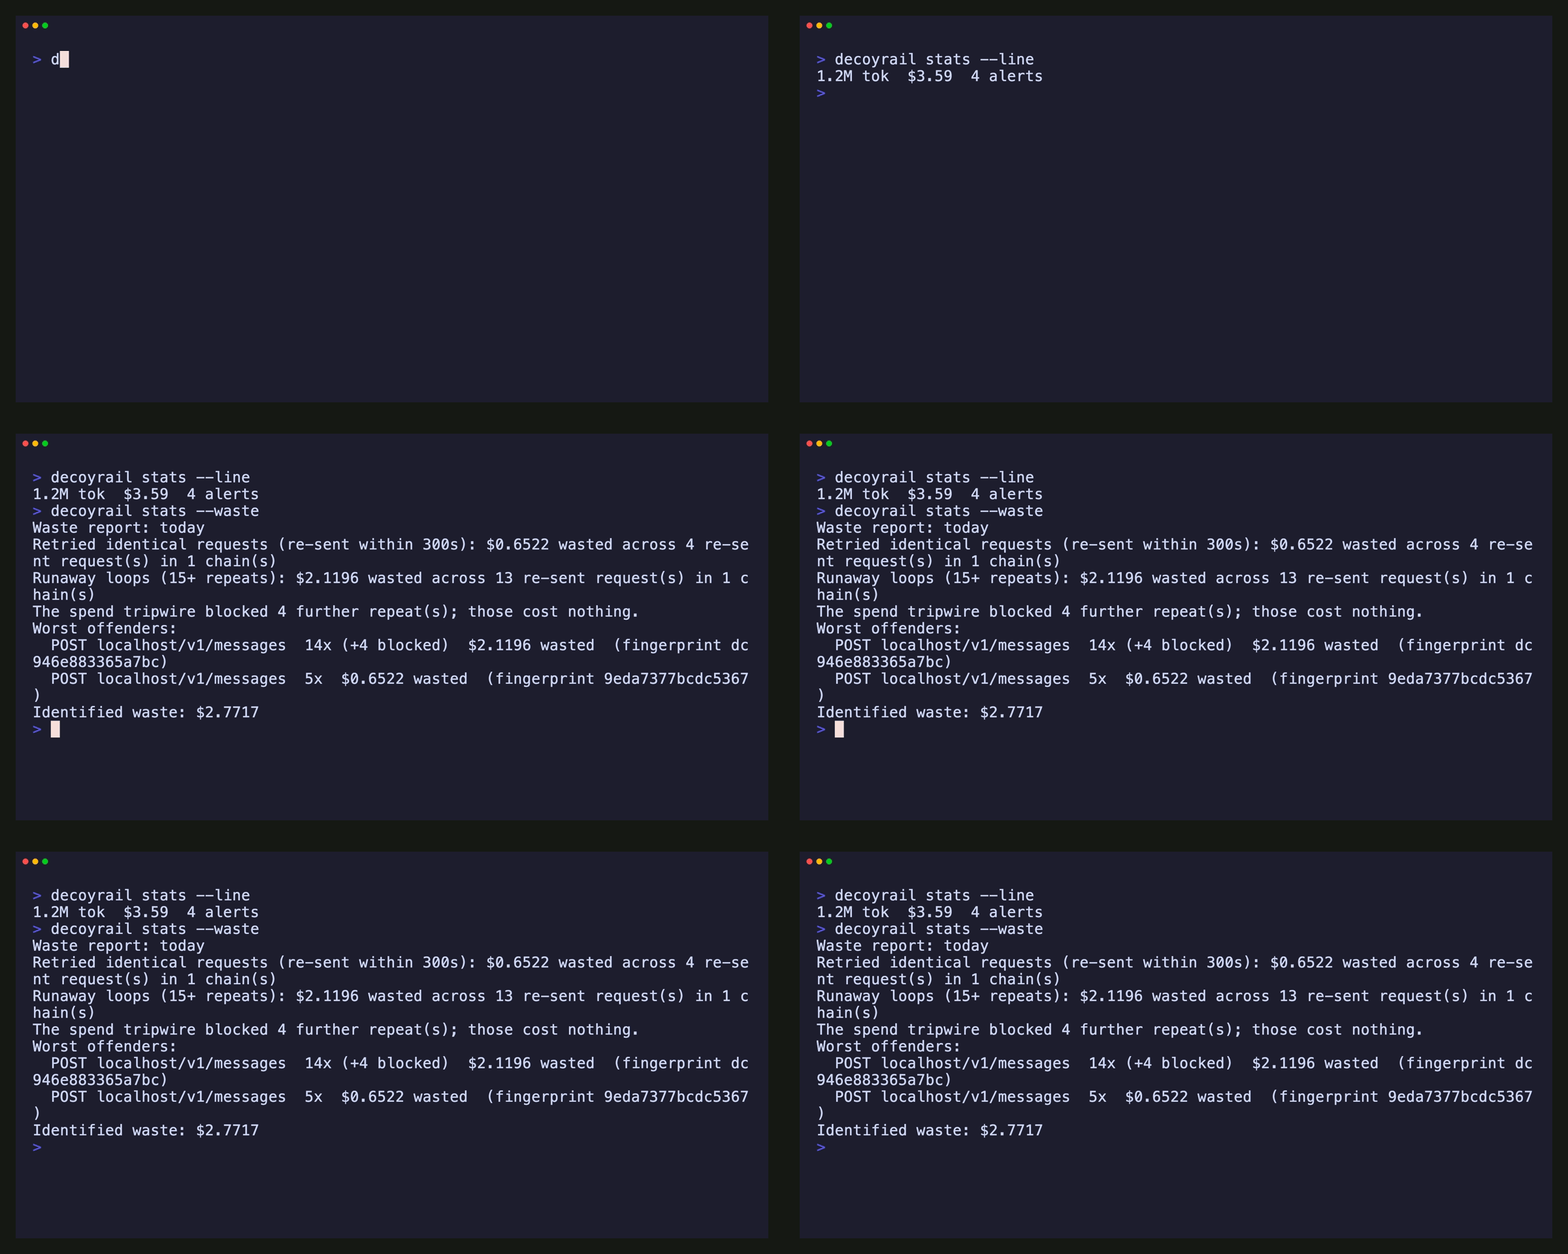
The numbers are deliberately conservative. Only identifiable waste is counted: byte-identical repeats, never "similar" requests. Billable dollars and plan-absorbed API-equivalent dollars stay separate, exactly as the meter keeps them. A repeat whose response carried no parseable usage is counted and flagged unpriced, never guessed at. And requests written before fingerprints existed can't be grouped, so the report says so instead of reporting zero.
The thresholds are the policy's [spend_tripwire] settings, so the report and the enforcement agree on what counts as a loop. --waste composes with the window flags and with --json (its own schema, versioned separately from the stats report). Everything is read from local state; the report never needs the network.